When trying to use Matplotlib
First consult:
- Types of plots
- Example plots
Colormaps are a good way of showing 3D data in 2D.
Input to plots
Plotting functions expect numpy.array or numpy.ma.masked_array as input, or objects that can be passed to numpy.asarray. Classes that are similar to arrays (‘array-like’) such as pandas data objects and numpy.matrix may not work as intended. Common convention is to convert these to numpy.array objects prior to plotting. For example, to convert a numpy.matrix
Matplotlib Notes
Matplotlib is a powerful Python library for creating static, animated, and interactive visualizations. Its most common module is pyplot, which provides a MATLAB-like interface.
import matplotlib.pyplot as pltBasic Example:
- Data is graphed on a figure
- Figures can contain one or more Axes
- Easiest way to create a figure is with pyplot.subplots, and Axes.plot being used to draw data.
- Shown with plt.show() (This last step is not necessary in a notebook environment)
fig, ax = plt.subplots()             # Create a figure containing a single Axes.
ax.plot([1, 2, 3, 4], [1, 4, 2, 3])  # Plot some data on the Axes.
plt.show()                           # Show the figure.
Elements of a figure:
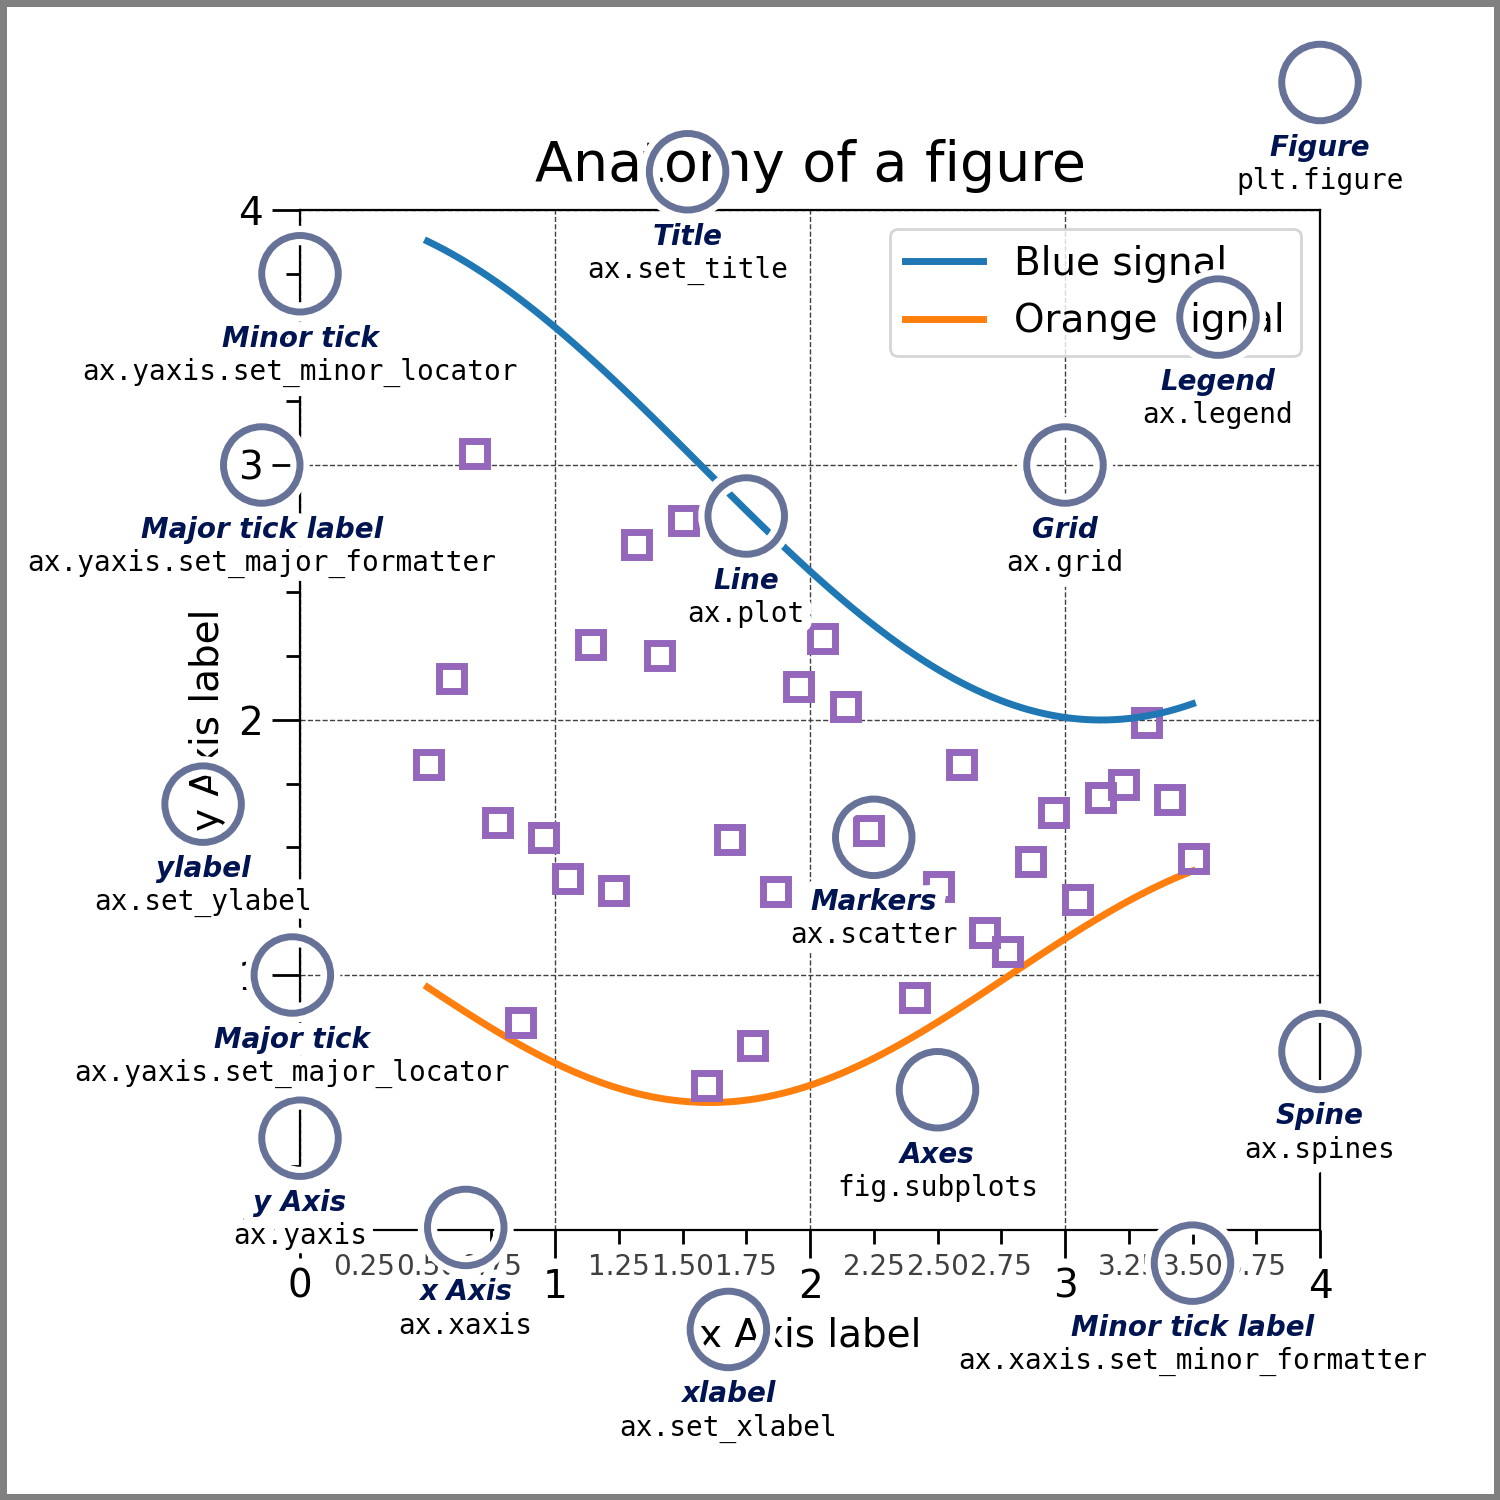
Figure:
Can be thought of as the Canvas.
The Figure keeps track of all the child Axes, a group of ‘special’ Artists (titles, figure legends, colorbars, etc.), and even nested subfigures.
Axes:
An Artist attached to a figure, and usually includes two or three Axis objects. They also have titles, and functions for renaming can be seen above.
Axis:
These objects set the scale and limits and generate ticks (the marks on the Axis) and ticklabels (strings labeling the ticks). The location of the ticks is determined by a Locator object and the ticklabel strings are formatted by a Formatter. The combination of the correct Locator and Formatter gives very fine control over the tick locations and labels.
Artist:
Everything is an artist? Artists are rendered to the canvas. Artists are usually exclusively tied to an Axes.