📗 -> 04/07/25: ECS189G-L4
🎤 Vocab
❗ Unit and Larger Context
Continuing with Linear Regression Models
✒️ -> Scratch Notes
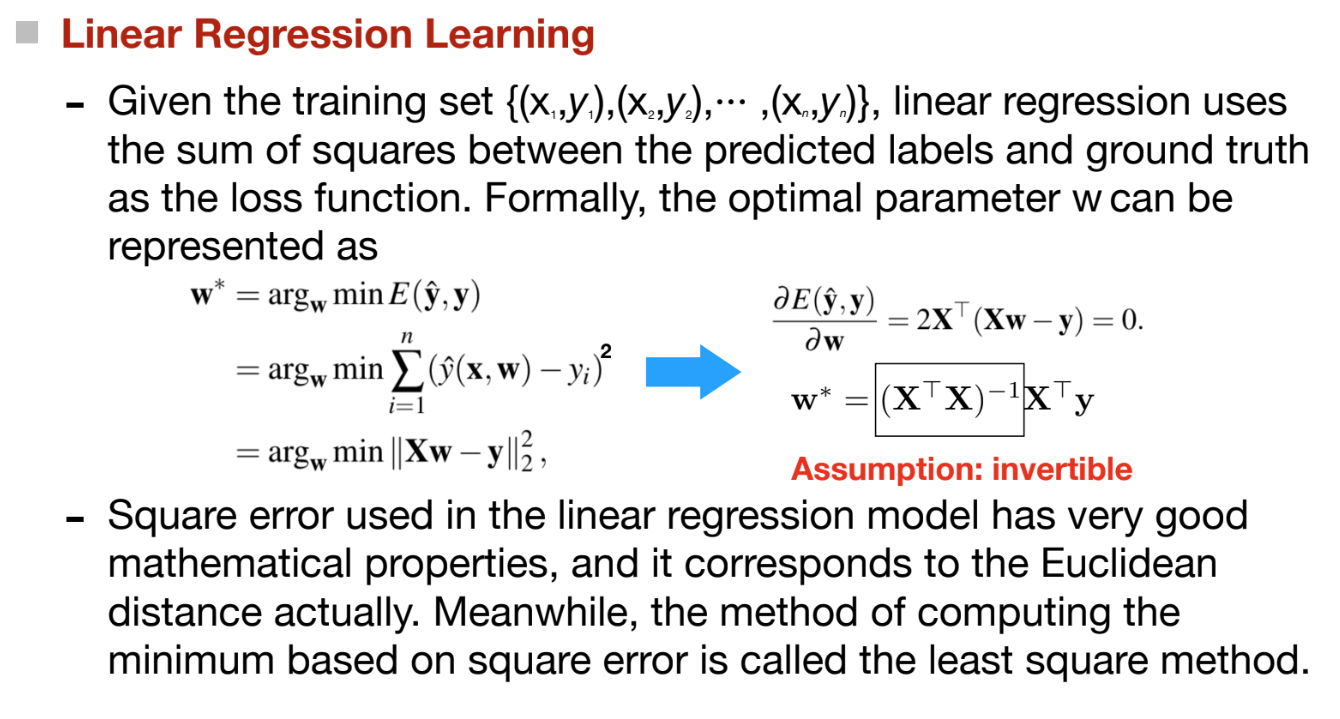
Regressions Models
Regression differs from classification tasks in the domain of labels. Instead of inferring the pre-defined classes that the data instances belong to, Regression tasks aim at predicting some real-value attributes of the data instances,
Formally:
Input: Given training data
We take the regression models of the linear feature combination form as an example:
are the weight parameters
Other Regression Models
Refresher - Norm
Refresher:
L-p norm:
Cases of p:
, the taxicab norm, manhattan norm, or L1-norm , euclidean norm, or L2-norm. This is the assumed norm of vector , maximum norm, as p approaches infinity the norm will be reduced to the maximum value
Back to regression
Ridge Regression Model
- Addresses some of the problems of OLS by imposing a penalty on the size of coefficients
- Objective function:
- Optimal Solution:
Lasso Regression Model - Lasso is a linear model that estimates sparse coefficients. Useful for its tendency to prefer solution with fewer parameter values
- Previously,
- Objective function:
- L1 norm is not differentiable, closed-form solution, but can be addresses by sub-gradient methods, least-angle regression and proximal gradient methods
Unsupervised Learning
- No supervision information is available and data instances may have no labels actually
- Task of learning some inner rules and patterns from such unlabeled data instances are called the unsupervised learning tasks, which provide some basic info for further data analysis
- USP LRN involves very diverse learning tasks, among which clustering tasks are the research focus and have broad applications
Clustering Tasks
Aim to partition the data into different groups, where instances in each cluster are more similar to each other than those from other clusters
- Input:
- Output: K disjoint groups C, with: C containing data, no groups having overlap, and jointly comprising the dataset
- Desired Properties: Data instances in the same cluster are similar to each other; Data instances in different clusters are dissimilar to each.
Distance Measures:
Find ways to quantify (dist: V x V -> R)
- Measures need to have the following properties:
- Non-negative (can’t have a negative distance)
- Identity:
- Symmetric:
- Triangular inequality:
- IE, cant have a shorter distance than the direct path
Frequently used measures:
- IE, cant have a shorter distance than the direct path
- Minkowsky Dist
- Finding the L-P norm distance between two vectors, and depending on P chosen can reduce to Minkowski Distance of P=1, Euclidean distance if P=2
- Manhattan Dist
- Case of Minkowsky distance, of L-p norm with p=1
- Euclidean Dist
- Case of Minkowsky distance, of L-p norm with p=2
- Chebyshev Dist
- Case of Minkowsky distance, of L-p norm with p=
K-means
An iterative clustering algorithm
- Initialize: Pick K random points as cluster centers
- Alternate:
- Assign data points to closest cluster center
- Change the cluster center to the average of its assigned points
- Stop when no points’ assignments change
Guaranteed to converge in a finite number of iterations:
- Running time per iteration is:
- O(KN) for assignment of points to clusters
- O(N) for changing cluster center to average of its assigned points
From an optimizing perspective:
- Step 1: If we fix
, we can optimize - Assign data points to clusters
- Step 2: If we fix
, we can optimize - Change cluster centers to the average of assigned points
Evaluation Metrics
Classification Confusion Matrix
- TP: True Positive
- FN: False Negative
- FP: False Positive
- TN: True Negative
| Predicted Positive | Predicted Negative | |
|---|---|---|
| Actual Positive | TP | FN |
| Actual Negative | FP | TN |
Classification Evaluation Metrics
- Accuracy:
- Precision:
. - True positive rate, how often is a Positive correct?
- To get 1, only predict positive when you’re absolutely sure
- Recall:
- Rate of identified positives, FN is one you let by.
- Can get 1 by predicting everything Positive
- F
: - F1 score frequently used
- “It’s an “average” between precision and recall that penalizes very large skew between the two and rewards a good balance between them.”
- Other metric too, ROC Curve, AUC
🧪 -> Refresh the Info
Did you generally find the overall content understandable or compelling or relevant or not, and why, or which aspects of the reading were most novel or challenging for you and which aspects were most familiar or straightforward?)
Did a specific aspect of the reading raise questions for you or relate to other ideas and findings you’ve encountered, or are there other related issues you wish had been covered?)
🔗 -> Links
Resources
- Put useful links here
Connections
- Link all related words