📗 -> 04/09/25: ECS189G-L5
🎤 Vocab
❗ Unit and Larger Context
Evaluation Metrics
Classification Confusion Matrix
- TP: True Positive
- FN: False Negative
- FP: False Positive
- TN: True Negative
Predicted Positive Predicted Negative Actual Positive TP FN Actual Negative FP TN Classification Evaluation Metrics
Link to original
- Accuracy:
- Precision:
.
- True positive rate, how often is a Positive correct?
- To get 1, only predict positive when you’re absolutely sure
- Recall:
- Rate of identified positives, FN is one you let by.
- Can get 1 by predicting everything Positive
- F
:
- F1 score frequently used
- “It’s an “average” between precision and recall that penalizes very large skew between the two and rewards a good balance between them.”
- Other metric too, ROC Curve, AUC
What did we cover in lecture slide 1?
Supervised: Classification
- Splitting data
- SVM
Supervised: Regression - Linear regression, Ridge, Lasso
Unsupervised: Clustering - K-Means
Evaluation Metrics
What do we do next:
- Read textbook chapters
- Read ML overview article
- 2.6 is about DL basics
✒️ -> Scratch Notes
Start off with a refresher of Evaluation Metrics
Classification Evaluation Metrics
See above
motivating example…
Intuition for F1 score:
- Imagine a rare disease, 5 cases out of 1000 patients.
- Predicting everything negative. Obviously a useless model, but pure accuracy is not a great measure.
- Accuracy = 99.5%
- Does not handle class imbalance well.
- Precision = 0/0 ~= 0
- Recall = 0/(0+5) = 0
- f1 = 0
- A harmonic mean of precision and recall
- Accuracy = 99.5%
- Predicting everything negative. Obviously a useless model, but pure accuracy is not a great measure.
Regression Evaluation Metrics
Explained Variance Regression Score
Mean Absolute Error
Mean Square Error
Median Absolute Error
R2-Score- Here:
- Here:
Each of them provides a different perspective on model performance.
Typically, a chart will be provided with model performance measured by each metric.
Clustering Evaluation Metrics
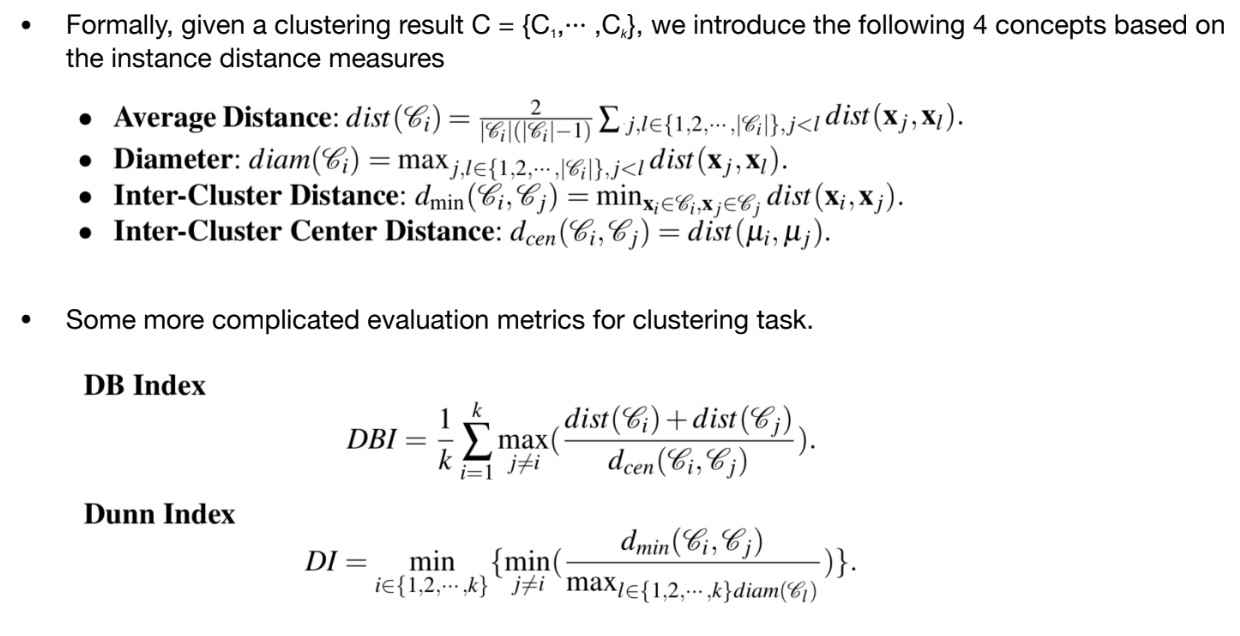
For these measures:
- Within clusters, we want to minimize the distances
- Between clusters, we want to maximize the distances
Measures
- Average distance
- Diameter
- Inter-Cluster Distance
- Inter-Cluster Center Distance
More Complicated Measures
- DB Index
- Tries to find maximum values within clusters, and compares against another cluster
- Find pairs that maximize terms
- Dunn Index
- Smaller DI is, the worse the result is
Also more clustering evaluations we wont cover
Project
Outline
- Env Setup: Python, Pytorch
- Warmup to Deep Coding: MLP code
- Images: CNN for image recognition
- Text: RNN models for classification and generation
- Graphs: GNN model for network embedding and node classification
from torch import Linear

layer1 = Linear(m,n) # m and n are dims
h = large(x) # h = Xw + b
#### No clue what he wrote here, could be linear layer large....
Coding a Deep Learning project is easy, but debugging is hard
🧪 -> Refresh the Info
Did you generally find the overall content understandable or compelling or relevant or not, and why, or which aspects of the reading were most novel or challenging for you and which aspects were most familiar or straightforward?)
Did a specific aspect of the reading raise questions for you or relate to other ideas and findings you’ve encountered, or are there other related issues you wish had been covered?)
🔗 -> Links
Resources
- Put useful links here
Connections
- Link all related words