Background:
| Unit Name | Symbol | Relative to Meters |
|---|---|---|
| Nanometer | ||
| Micrometer (micron) | ||
| Millimeter | ||
| Centimeter | ||
| Decimeter | ||
| Meter | 1 |
Week 1 - Intro & Techniques
Intro Techniques Local
NPB163-Problem-Set-1
Techniques:
- Levels of analysis for each question
The key things to focus on:
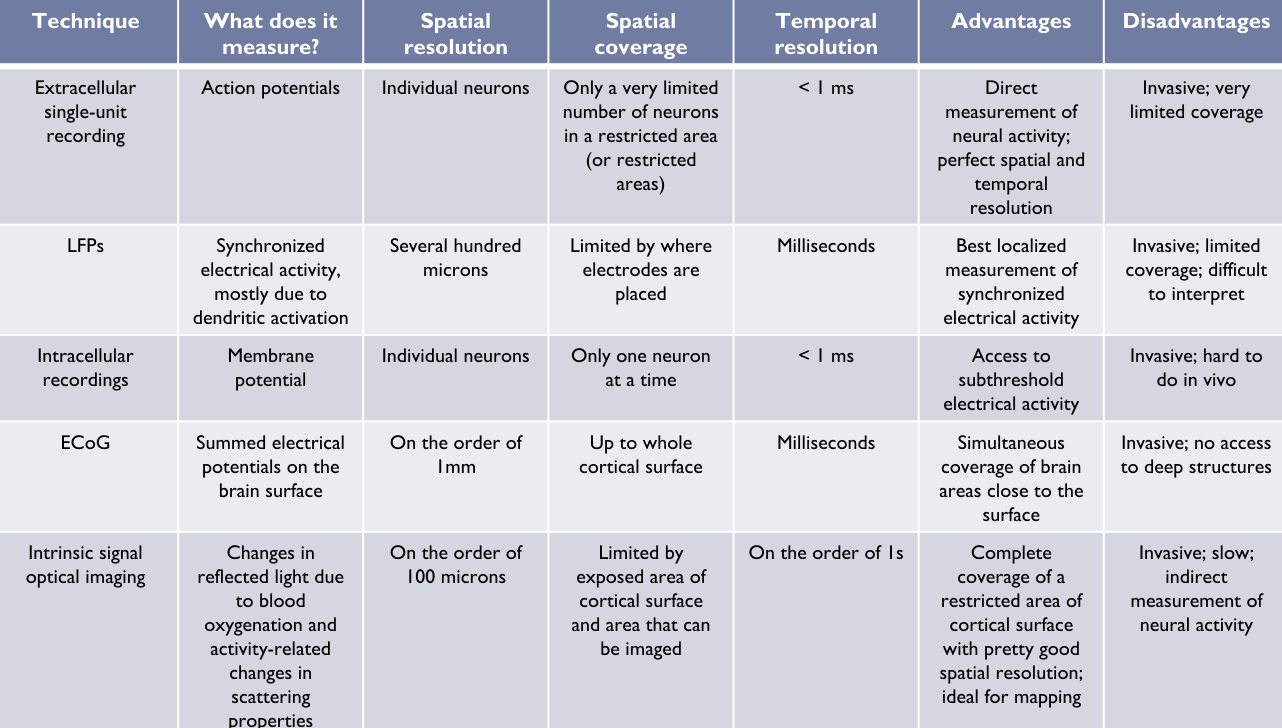
- What does it measure?
- What is its spatial resolution? (single / multi unit, populational, etc. )
- Single neuron, neuron in an area, whole brain, etc.
- Temporal resolution? (Measuring a precise action potential, or more like a BOLD activity? )
- Proper situation to employ activity?
- Is invasiveness necessary?
Spatial resolution vs Spatial coverage
- Is invasiveness necessary?
Scratch Notes of each
Extracellular Recordings:
- Invasive technique, measures with a tiny metal sharp tip with an electrode. Needs to be placed directly on area of interest
- Has very limited coverage, only recording from one spot.
- Used for single-unit recordings, where the external voltage of a single neuron is recorded
- How strong recorded voltage is depends on distance from soma and size of neuron
- Frequently get data in the form of raster plots or peri-stimulus time histograms (PSTHs)
- Can also be used for Multi-unit activity (MUA) and for Local Field Potentials (LFP)
- Can also get wider coverage with multi electrode arrays (Utah arrays IE)
Intracellular Recordings: - Advantage is that they are able to track IPSPs and EPSPs through inner membrane voltage. However, they are difficult to perform, especially in vivo
Electrocorticography (ECoG) / intracranial EEG (iEEG) - An electrode grid is placed on cortical surface and provides LFP like signals from it
- High spatial coverage (covers a large amount of cortex) but low spatial resolution (records on the scale of LFPs and not direct neuron activity)
Optical Imaging - Part of the skull is removed to allow imaging of cortical surface with a CCD camera, which can be combined with the light absorption properties of oxy- and deoxyhemoglobin (HbO2 and HbR to provide metabolic information about neural activity
- An increase in neural activity is followed by a relatively fast and local reduction in hemogoblin oxygenation, followed by a slower and slightly more global increase in blood flow/volume and hemoglobin oxygenation
- Optical imaging will pick up the first spike, will fMRI picks up the second
- Depending on wavelength of illumination chosen, changes in total hemoglobin and/or changes in hemoglobin oxygenation can be measured
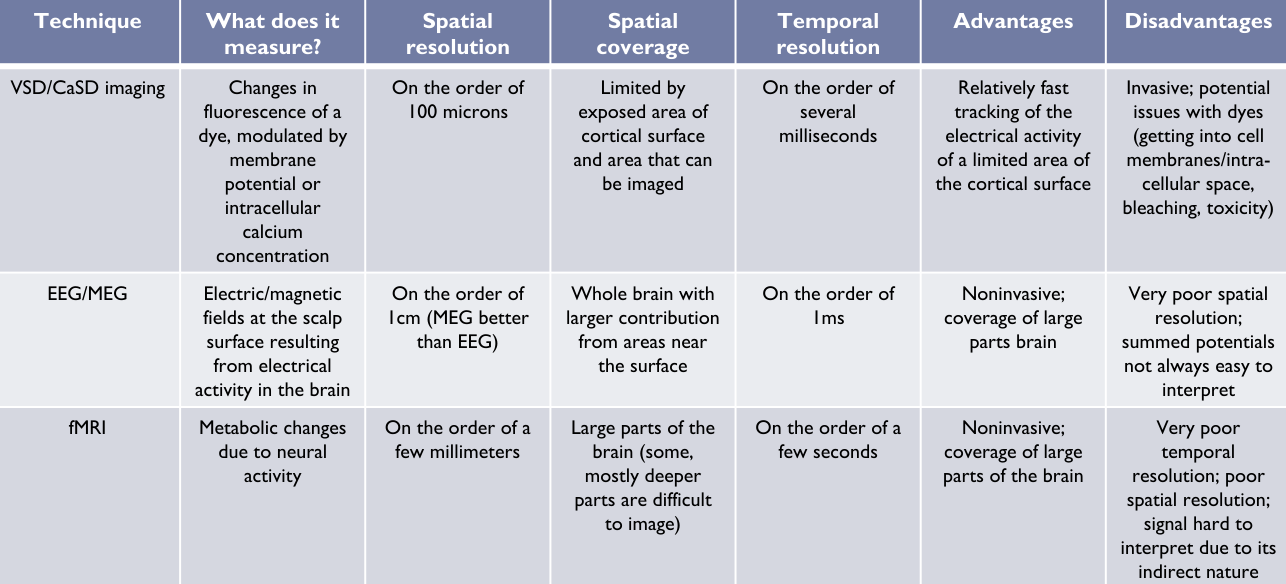
Voltage-sensitive dye (VSD) / Calcium Sensitive dye (CaSD) imaging - VSC can be used to directly measure image electrical activity. VSDs bind across a neuro’s membrane and change their flourescence according to membrane ponetial.
- Calcium-sensitive dyes are instead sensitive to intracellular calcium concentration, and are sensitive to the calcium influx of a neuron firing.
- They provide a larger signal, but are more difficult to get into neurons.
EEG
MEG
fMRI
Week 2 - Neural Codes
Information Primer Local
Neural Codes Local
NPB163-Problem-Set-2 - Information Theory
Weeks 3-5 - Sensory Systems
Sensory Systems 1 Local
NPB163-Problem-Set-3
Photoreceptors
- Located on the retina (back of the eye)
- 4 different types
- 1 rod
- 3 types of cones
- L cones (red), M cones (green), S cones (blue)