Analysis of Eyewitness Testimony Using Electroencephalogram Signals
Link to Source: link
- Presented at a conference, November 2021
Quick Summary:
- Methodology:
- They showed participants a short crime scene video, then later showed them a line up and asked them to identify the culprit
- The recorded EEG data from the participants response to the faces was used to train a SVM model
- Feature selection:
- Bands: theta, alpha, beta
- ERPs: P100, N170, P300, P200
- Divided epochs into 0.25s segments with an overlap of 0.125s (to give context)
- ANOVA used to select highest ranked features
- Findings:
- They were able to get a surprisingly good accuracy, 0.864
- However, they only use correctly identified trials and it was effectively a binary classification problem (is this the neural signature of a person correctly recognizing an innocent suspect, or correctly recognizing a guilty criminal?)
- This simplifies the problem significantly, and doesn’t address issues of incorrect recognition
Takeaway:
- The entire study is relevant really. It’s what we’re aiming to do. Take the time to really read through it!
- There is a difference between ERPs for research, and ERPs for BCI classification (research can afford to be noisy and average it away, we can’t). Important to find important discriminating features.
Scratch Notes:
Abstract
Using EEG markers to attempt to identify faces.
Creates a study design to discriminate culprit and innocent faces from witness recordings.
Feature Extraction:
- Time Domain and Frequency domain characteristics of single trials
- This means that they transform from time-voltage (raw recording) to time-frequency.
Classification:
- This means that they transform from time-voltage (raw recording) to time-frequency.
- SVM
Section I: Introduction
EEG High Level Overview:
- Potential to be used to measure latent variables directly, like stress, mood, and mental workload
- Also useful in creating BCI
- Unfortunately, it has a low signal-to-noise ratio (SNR)
- Addressed in studies by performing time locked averages in hopes that noise will average out. Cool example of that below (Fig 1.4 from Prof. Luck’s ERP Handbook)
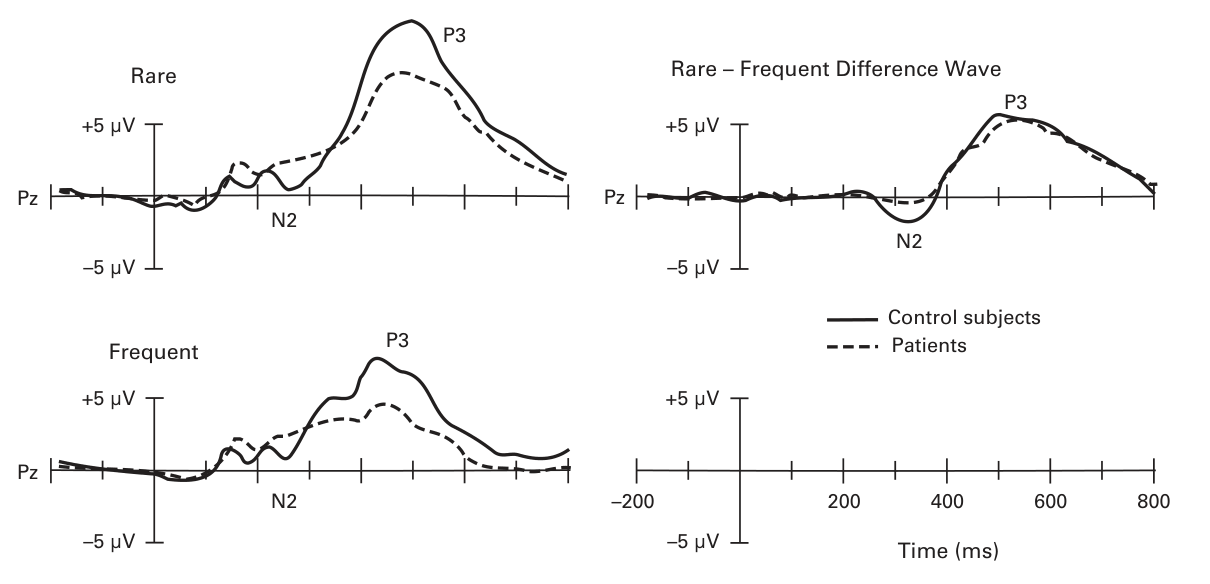
- Addressed in studies by performing time locked averages in hopes that noise will average out. Cool example of that below (Fig 1.4 from Prof. Luck’s ERP Handbook)
- BCI issues with low SNR
- BCI rely on complicated signal processing methods instead. Hoping to extract task related components
- ICA?
- ANOVA?
- There is also high inter-subject variability, BCI’s often need to do off-line calibration
- BCI rely on complicated signal processing methods instead. Hoping to extract task related components
- In this paper, they:
- Follow the typical BCI Pipeline to select the most relevant features of EEG signals
- Feature Extraction
- Feature Ranking
- Univariate test (ANOVA) used to select best features
- Classification
- SMVs, linear and non-linear attempted
- This methodology repeated for each participant, and the most frequent features were studied
- Follow the typical BCI Pipeline to select the most relevant features of EEG signals
Section II: Materials and Methods
Processing steps were performed at an intra-participant level Referenced Paper
Dataset
Taken from P.Bem-Haja’s experiment here: Psychophysiology of Eyewitness Testimony
28 participants, 8 trials
- In a trial:
- A theft videos of 20 secs displayed in which the culprit is presented to the witness
- EEG recorded while participants see grayscale videos of faces, 5 distractors and 1 culprit.
- The lineup presented 10 times in random order. Face displayed for 1.5 secs.
- Each participant asked to classify each as culprit or distractor.
- Recording
- 32 electrodes on a ANT cap according to 10-20 system
- Sampled at 2048 Hz
Preprocessing
- EEG down sampled to 512 Hz
- zero-phase filtering strategy?
- Epoched around face presentation, from -0.5-3 seconds
- Trials discarded if participant didn’t answer or gave multiple answers
- Trials split among the 4 classes (hit, false alarm, rejection, miss)
Feature Extraction
“Two different types of signal characteristics can be extracted from brain signals”
- Frequency related features
- Describe energy in frequency bands
- Time related features
- Describe stimulus ERPs
Used MATLAB tools, specifically EEGLAB
- Describe stimulus ERPs
Frequency Domain
Selected three bands:
- theta, alpha, beta
Theta: Associated with these mental operations:
- Attention
- Learning
- Memory
Beta: Active, busy, anxious thinking
Alpha: There is assymetry of the alpha waves involving emotion and motivation (Source Referenced)
Used spectogram methodology for each single trial signal.
- Divide into 0.25s segments with an overlap of 0.125s
- 27 subsegments obtained
The frequency analysis of each sub-segment, multiplied by a Hamming window, is calculated for the range, (30)Hz with a resolution of 0.1Hz.
- Cites the Physiology Paper as evidence
Processed signal and calculated energy in the 3 bands selected.
The energy in theta, alpha and beta band were calculated adding the energy of the energy values belonging to the [4], (8)Hz, [8], (13)Hz and [13], (30)Hz respectively.
Time Domain
Analyzed in the domain to see data from time perspective
- Mapping peaks
These peaks are enhanced and visible in epoch-averaged signals and are called Event Related Potentials (ERPs)
The most important ERPs for this (face recognition) will likely be:
- P100: Invoked on any visual evoked potential
- N170: Associated with visual processing of stimuli
- P300: Occurrence of rare events
- Authors also cite the P200 in facial recognition: paper
To generalize, they use an infinite impulse response (IIR) filter.
- Straight up gobeldygook:
- The 4th order IIR filter was passband filter between 2 and 12 Hz designed using the Butterworth approach.
All the EEG channels were considered with amplitude, and latency of the ERP components
Feature Vectors
The extraction methods produce 2 seperate feature vectors:
- Frequency: 3x27x30 (3 freq bands x 27 time intervals x 30 channels)
- 2430 features per trial
- Time: 4x4x40 (4 amplitude x 4 latency values for each ERP x 30 channels)
- 240 features per trial
Dataset balancing
The present dataset is unbalanced with only 10% of the answers provided were wrong and the experiment itself consisted in 5 distractor face for each culprit and this problem usually affects the behavior of machine learning models. Because of that, this study proceeded with only the correctly identified trials and therefore it is a binary classification problem.
To balance the data, they reduced the number of trials with distractors to match the number of culprit trials.
- Priority given to earlier trials, as they had more attention
Classification pipeline
Used scikit-learn
- Feature Ranking:
- Ranked all features using ANOVA
- Uses an f-test and makes a decision as to whether there is a difference among sample means of groups
- Normalization
- Z-score scaling, removes the mean and unit-scales features
- “The normalization parameters (mean and standard deviation) were calculated in the training set and applied also in the test sets”
- Does this make sense?
- Definitely need to scale the data in the cross-validation set, but is this how to go about it?
- SVM Classification
- Either classify in:
- Input space (linear kernel)
- Mapped feature space (RBF kernel)
- Radial basis function kernel
Could experiment with some other kernel
- Radial basis function kernel
- Either classify in:
- Cross-Validation
- All models evaluated at a participant level by cross validation (k=5)
Results
After ANOVA ranking, they chose 100 frequency features (out of 2430) and 50 time features (out of 240)
Feature Analysis
They used the following electrodes:
- Frontal region: Fp1, Fp2, Fpz, F1, F3, F2, F4, Fz, FC5, FC1, FC2 and FC6.
- Parietal region: Cz, C3, C4, CP1, CP2, CP5, CP6, Pz, P3, P4, P7 and P8.
- Temporal region: T7 and T8.
- Occipital region: POz, O1, O2 and Oz.
Frequency:
The beta band was the dominant band, then theta, then alpha.
Time Domain:
Amplitude was more informational than latency, and the P100 was
Follow Up Reading:
Sci-kit learn
Review of classification algos for EEG
[10 Year Review of BCI]
ANOVA?
Data mining?
Questions About Reading
- What exactly happening with intraparticipant processing?
- What diff person to person. ANOVA?
- Frequency sampling?
- Should we be worried about our sampling rate compared to theirs?
- HOW (concretely) will the data be different?
- Should we still implement filtering?
- What is a Hamming window?
- The frequency analysis of each sub-segment, multiplied by a Hamming window, is calculated for the range [4], (30)Hz with a resolution of 0.1Hz
- What is an infinite impulse response (IIR) filter?
- And a butterworth approach?
- Adding a CNN to find short range effects in our data?
- Experiment with frequency bins (personal alpha calibaration IAF?)
- Experiment with epoch/bin size/length
- What does 10 times mean?
- The lineup of six images includes five distractors and a culpit, in random order, were presented 10 times for each participant.